Case study · Product foundations · Agremo
Leaving a trace – the foundations are still in place years later.
I designed Agremo’s software from the moment they began building it. The start-up has since grown into a company working across several continents, and much of what we set up at the start is still in use.
Part oneHow it started
It began with another company and an idea without a name.
Before Agremo existed, its founders had already brought me in to design portals for Logit, another of their companies. When they came up with a new idea, a platform that turns drone and satellite images into insights about crops, they called me again. There was no brand, no product and no screen yet, only the idea and a team of very capable engineers.
We started from nothing, and between 2017 and 2024 I designed almost everything Agremo showed to the world. I worked directly with their CTO, engineers, product owner, marketing manager and COO, from the first brainstorming sessions through to the finished screens and printed materials, so every decision was made with the people who would build it and sell it.
Part twoThe brand
A brand built from zero, ready for a whole family of products.
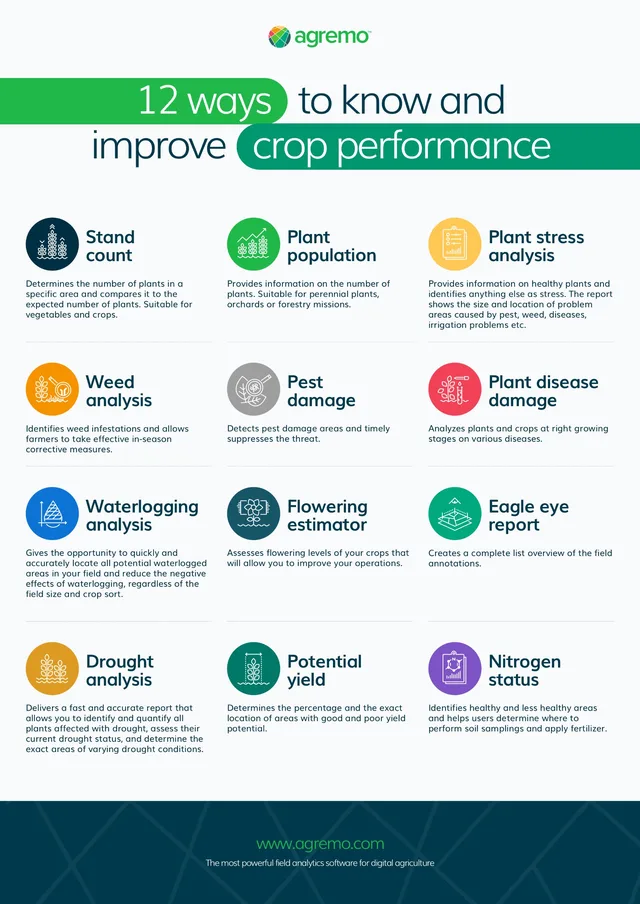
The logo was created in partnership with a design agency, and from there I took the brand into everything else. The most lasting part was the icon system: one symbol and one colour for every analysis the platform offers, used the same way in the application, on the website and in print. The icon system grew from it, and has a section of its own below.


Colour
One green leads, the rest support it.
The deep ink grounds it and the light surface gives it room, while the analysis colours appear only where they mean something.
Agremo Green
- Hex
- 20B849
- RGB
- 32 / 184 / 73

Deep Field
- Hex
- 002F43
- RGB
- 0 / 47 / 67
Morning Light
- Hex
- F9FAFC
- RGB
- 249 / 250 / 252
Analysis colours
Orange
#F69301Yellow
#FFC854Red
#EF4457Blue
#0D73D5Purple
#7E53C6Teal
#00A87FPetrol
#175668
Part threeIconography
An icon for every situation, drawn on a grid first.
No part of the brand took more time than the icons, and none paid back more. Every analysis, report and crop condition has its own symbol, built on the same circle, grid and line weight, so it reads the same in the application, in a report, on a poster or on a trade fair stand. Each one began as a construction drawing before it became a finished symbol.
 Stand count
 Plant population
 Plant stress
 Weed analysis
 Pest damage
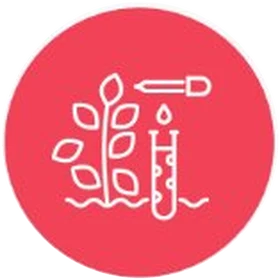 Plant disease
 Waterlogging
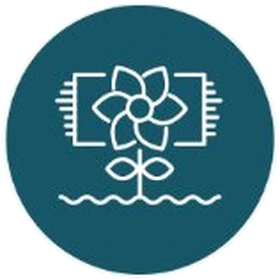 Flowering estimator
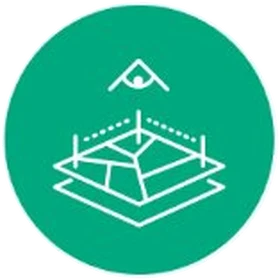 Eagle eye report
 Drought analysis
 Potential yield
 Nitrogen status
Part fourThe application
The whole application, module by module.
I designed the entire web application: Crop Monitoring, Field Trials, Plant Counting and the Precision Farming tools, from wireframes and prototypes to final screens. The pieces below are rebuilt from it, with the names and numbers changed.
01Field
Every analysis starts with a field.
A farmer marks the field, uploads the flight and follows it from stitching to the finished map, so nobody has to ask whether the data has arrived.
02Tools
The map stays in front, the tools stay at hand.
A slim rail on the left holds everything a farmer does on the map: pins, measurements, boundaries and layers. Each tool explains itself the moment it is chosen.
03Analysis
One colour per analysis, everywhere.
Each analysis has its own icon and colour, and they mean the same thing in the application, on the website and in every brochure.
04Result
The result opens in a drawer.
Results slide in from the right without hiding the map. The number comes first, then a plain sentence about what it means, with the direction shown by a sign, not colour alone.
05Action
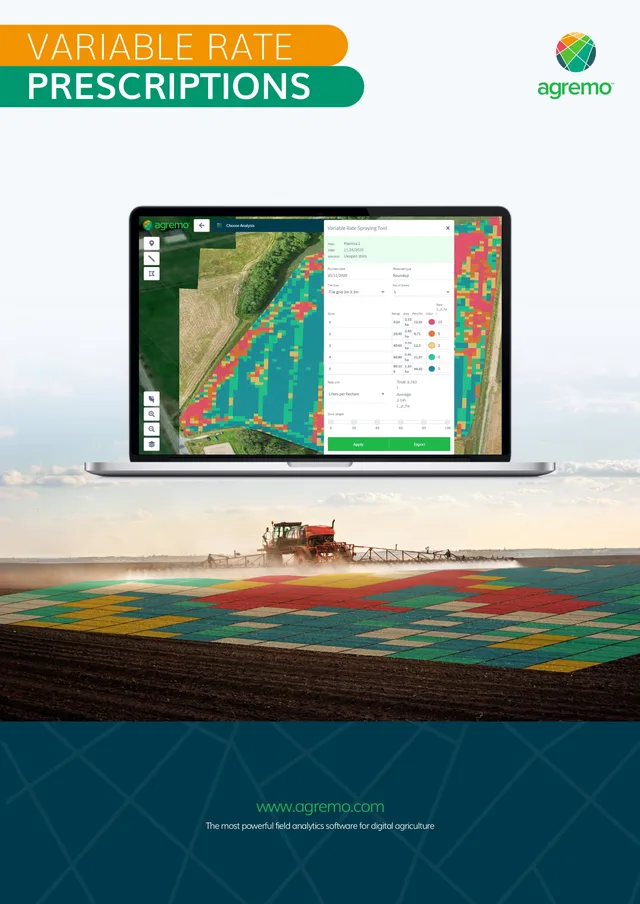
From the result to the sprayer.
The map is split into zones with their own dose and sent straight to the machines in the field, which is where the analysis finally pays for itself.
06Season
The right analysis at the right stage.
Each analysis has its moment in the season. As the crop grows, the application suggests the report that fits, so nobody runs a weed analysis on a field that is already in flower.
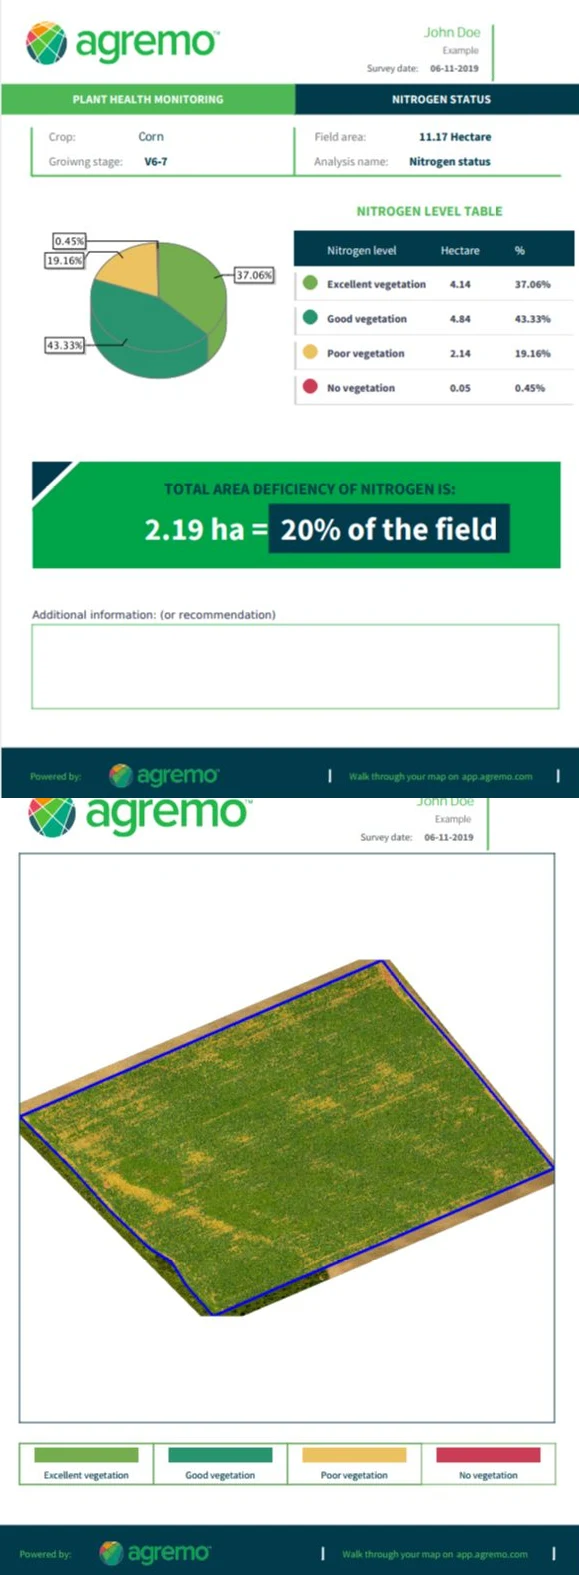
07Mobile
Reports that fit in a pocket.
In the field, people check results on a phone. The reports are built to be read on a small screen: the key figure in a bold green band, a clear table of levels and a map of the field, ready to share with an agronomist.
Part fiveEverything around it
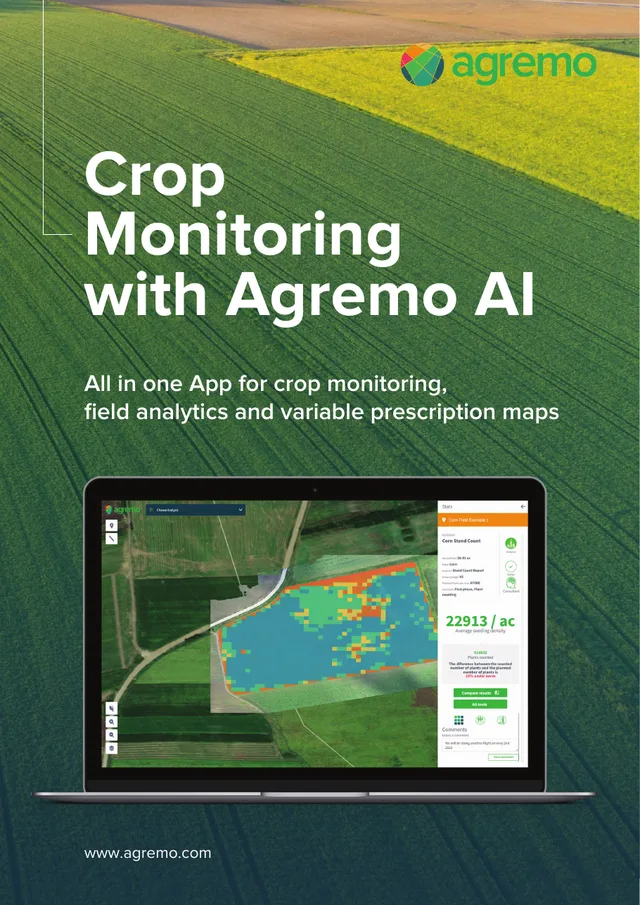
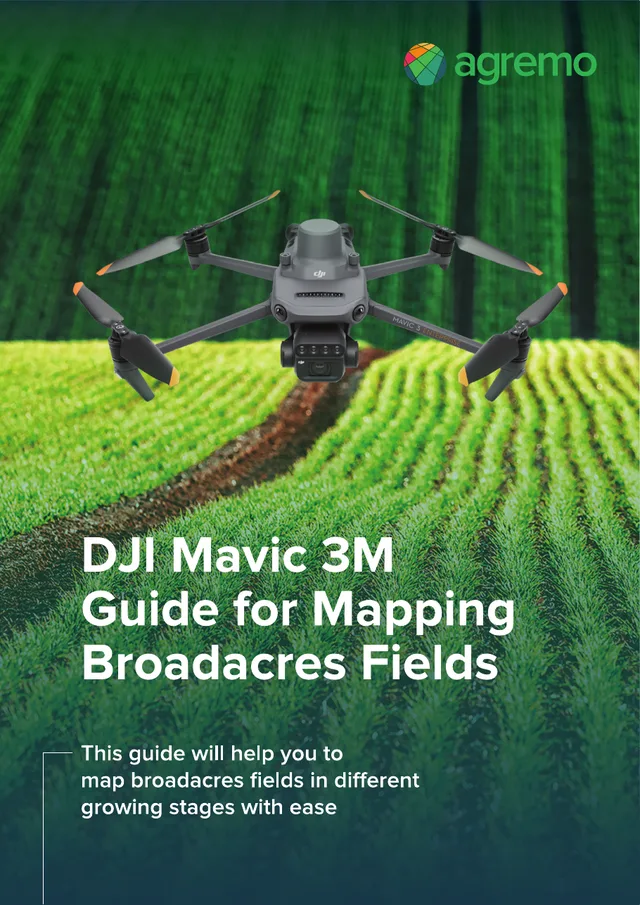

And everything the brand touched beyond the screen.
A young company needs far more than an application. I designed the website, whitepapers and every marketing brochure, posters, and even helped arrange their offices. When Agremo went to trade fairs in the United States, the stands and materials were part of the job too.
It was a rare kind of project, one where the same designer shaped the product, the brand and the space around them, and it was genuinely a pleasure to work with this team.
OutcomeWhere it stands
Years later, the foundations are still in place.
Agremo grew from an idea into a company working across several continents. Much of what we set up together, the visual language, the icon system and the structure of the application, still carries the product today. That is the kind of trace I hope to leave on every project.